What is Parallelism?
Parallelism means that SQL Server is able to run operators in an execution plan across multiple worker threads. The goal of parallelism is to improve the throughput of your queries.
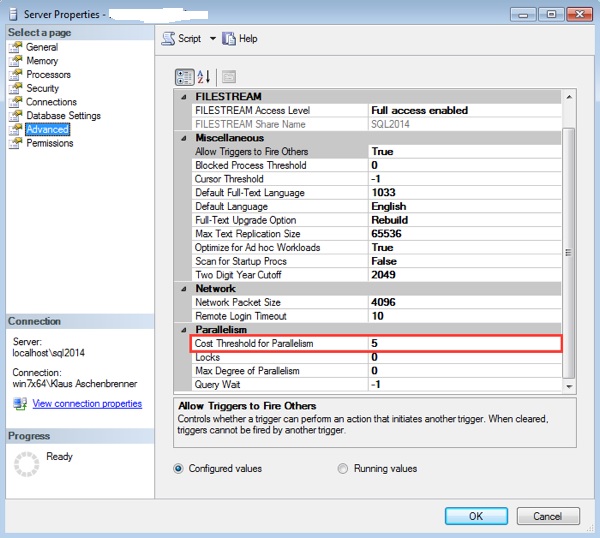
The first configuration option that influences parallelism in SQL Server is the so-called Cost Threshold for Parallelism:
Cost Threshold for Parallelism – the minimum cost of a query before SQL Server will consider dividing the work across multiple cores.
The cost threshold for parallelism option can be set to any value from 0 through 32767. The default value is 5.
SQL Server ignores the cost threshold for parallelism value under the following conditions:
- Your computer has only one processor.
- Only a single CPU is available to SQL Server because of the affinity mask configuration option.
- The max degree of parallelism option is set to 1.
The cost threshold for parallelism option is an advanced option.
If you are using the sp_configure system stored procedure to change the setting, you can change cost threshold for parallelism only when show advanced options is set to 1. The setting takes effect immediately (without a server restart).
Example
The following example sets the cost threshold for parallelism to 50 seconds.
sp_configure ‘show advanced options’, 1;
GO
reconfigure;
GO
sp_configure ‘cost threshold for parallelism’, 10;
GO
reconfigure;
GO
What value assign for Cost Threshold for Parallelism. Most of the articles you can find recommend you to set it up equal to 50. But why?
Jonathan Kehayias wrote a query to search the plan cache for existing parallel plans and see the cost associations to current plans that executed parallel:
SET TRANSACTION ISOLATION LEVEL READ UNCOMMITTED;
WITH XMLNAMESPACES
(DEFAULT ‘http://schemas.microsoft.com/sqlserver/2004/07/showplan’)
SELECT
query_plan AS CompleteQueryPlan,
n.value(‘(@StatementText)[1]’, ‘VARCHAR(4000)’) AS StatementText,
n.value(‘(@StatementOptmLevel)[1]’, ‘VARCHAR(25)’) AS StatementOptimizationLevel,
n.value(‘(@StatementSubTreeCost)[1]’, ‘VARCHAR(128)’) AS StatementSubTreeCost,
n.query(‘.’) AS ParallelSubTreeXML,
ecp.usecounts,
ecp.size_in_bytes
FROM sys.dm_exec_cached_plans AS ecp
CROSS APPLY sys.dm_exec_query_plan(plan_handle) AS eqp
CROSS APPLY query_plan.nodes(‘/ShowPlanXML/BatchSequence/Batch/Statements/StmtSimple’) AS qn(n)
WHERE n.query(‘.’).exist(‘//RelOp[@PhysicalOp=”Parallelism”]’) = 1
Another approach how to find out Cost Threshold for Parallelism value you can find here:
CREATE TABLE [dbo].[PlanCacheStatementCost](
[PCSCID] [INT] IDENTITY(1,1) NOT NULL,
[StatementText] [VARCHAR](8000) NOT NULL,
[StatementSubTreeCost] [FLOAT] NOT NULL,
[UseCounts] [INT] NOT NULL,
[StatementEstRows] [INT] NOT NULL,
[Avg_Worker_Time] [INT] NULL,
[Avg_Logical_Reads] [INT] NULL,
[Avg_Elapsed_Time] [INT] NULL,
[CaptureDateTime] [DATETIME] NOT NULL
) ON [PRIMARY]
DECLARE @CaptureDate DATETIME
SELECT @CaptureDate = DATEADD(minute, DATEDIFF(minute, 0, DATEADD(second, 30 – DATEPART(second, GETDATE() + ’00:00:30.000′), GETDATE())), 0)
CREATE TABLE #StatementSubTreeCost
(
StatementSubTreeCost FLOAT ,
StatementId INT ,
UseCounts BIGINT ,
plan_handle VARBINARY(64)
);
WITH XMLNAMESPACES
(DEFAULT ‘http://schemas.microsoft.com/sqlserver/2004/07/showplan’)
INSERT INTO #StatementSubTreeCost (StatementSubTreeCost, StatementId, UseCounts, plan_handle)
SELECT
c.value(‘@StatementSubTreeCost’, ‘float’) AS StatementSubTreeCost
,c.value(‘@StatementId’, ‘float’) AS StatementId
,cp.UseCounts
,cp.plan_handle
FROM sys.dm_exec_cached_plans AS cp
CROSS APPLY sys.dm_exec_query_plan(cp.plan_handle) AS qp
CROSS APPLY qp.query_plan.nodes(‘//StmtSimple’) t(c)
WHERE cp.cacheobjtype = ‘Compiled Plan’
AND qp.query_plan.exist(‘//StmtSimple’) = 1
AND c.value(‘@StatementSubTreeCost’, ‘float’) > 5
ORDER BY c.value(‘@StatementSubTreeCost’, ‘float’) DESC;
WITH XMLNAMESPACES
(DEFAULT ‘http://schemas.microsoft.com/sqlserver/2004/07/showplan’)
,cQueryStats
AS (
SELECT query_hash
,SUM(total_worker_time / NULLIF(qs.execution_count,0)) AS avg_worker_time
,SUM(total_logical_reads / NULLIF(qs.execution_count,0)) AS avg_logical_reads
,SUM(total_elapsed_time / NULLIF(qs.execution_count,0)) AS avg_elapsed_time
FROM sys.dm_exec_query_stats qs
GROUP BY query_hash
)
INSERT INTO dbo.PlanCacheStatementCost
( StatementText ,
StatementSubTreeCost ,
UseCounts ,
StatementEstRows ,
Avg_Worker_Time ,
Avg_Logical_Reads ,
Avg_Elapsed_Time ,
CaptureDateTime
)
SELECT
LEFT(c.value(‘@StatementText’, ‘varchar(max)’),8000) AS StatementText,
s.StatementSubTreeCost
, s.usecounts
, CAST(c.value(‘@StatementEstRows’, ‘float’) AS BIGINT) AS StatementEstRows
, qs.avg_worker_time
, qs.avg_logical_reads
, qs.avg_elapsed_time
, @CaptureDate
FROM #StatementSubTreeCost s
CROSS APPLY sys.dm_exec_query_plan(s.plan_handle) AS qp
CROSS APPLY qp.query_plan.nodes(‘//StmtSimple’) t(c)
LEFT OUTER JOIN cQueryStats qs ON c.value(‘xs:hexBinary(substring(@QueryHash,3))’,’binary(8)’) = query_hash
WHERE c.value(‘@StatementId’, ‘float’) = s.StatementId
ORDER BY c.value(‘@StatementSubTreeCost’, ‘float’) DESC, s.StatementSubTreeCost DESC
DROP TABLE #StatementSubTreeCost
This script will grab every execution plan in the plan cache that has an estimated subtree cost over five and put it into the table. You’ll get a good idea by running it a couple time what that number should be. Note that this is a very expensive query and should only be run on a Production environment with great care!
Look at the StatementSubTreeCost value and decide whether you want to run these queries in parallel or not and set up Cost Threshold for Parallelism close to its max value or to its average value as you can see from the below script. But it would be better if you test first.
CREATE TABLE #SubtreeCost(StatementSubtreeCost DECIMAL(18,2));
;WITH XMLNAMESPACES
(DEFAULT ‘http://schemas.microsoft.com/sqlserver/2004/07/showplan’)
INSERT INTO #SubtreeCost
SELECT
CAST(n.value(‘(@StatementSubTreeCost)[1]’, ‘VARCHAR(128)’) AS DECIMAL(18,2))
FROM sys.dm_exec_cached_plans AS cp
CROSS APPLY sys.dm_exec_query_plan(plan_handle) AS qp
CROSS APPLY query_plan.nodes(‘/ShowPlanXML/BatchSequence/Batch/Statements/StmtSimple’) AS qn(n)
WHERE n.query(‘.’).exist(‘//RelOp[@PhysicalOp=”Parallelism”]’) = 1;
SELECT StatementSubtreeCost
FROM #SubtreeCost
ORDER BY 1;
SELECT AVG(StatementSubtreeCost) AS AverageSubtreeCost
FROM #SubtreeCost;
SELECT
((SELECT TOP 1 StatementSubtreeCost
FROM
(
SELECT TOP 50 PERCENT StatementSubtreeCost
FROM #SubtreeCost
ORDER BY StatementSubtreeCost ASC
) AS A
ORDER BY StatementSubtreeCost DESC
)
+
(SELECT TOP 1 StatementSubtreeCost
FROM
(
SELECT TOP 50 PERCENT StatementSubtreeCost
FROM #SubtreeCost
ORDER BY StatementSubtreeCost DESC
) AS A
ORDER BY StatementSubtreeCost ASC))
/2 AS MEDIAN;
SELECT TOP 1 StatementSubtreeCost AS MODE
FROM #SubtreeCost
GROUP BY StatementSubtreeCost
ORDER BY COUNT(1) DESC;
DROP TABLE #SubtreeCost;
The possible result:

What is Max Degree of Parallelism?
Max degree of parallelism controls how many processors in the SQL server can be used on any one single query. Even if your query has multiple parallel operators, the operators will share the CPUs assigned to the query, which you can limit by the ‘max degree of parallelism’ setting. The default value for MAXDOP is equal to 0, meaning SQL Server will not limit the number of parallel threads it will create for a query, but it’s usually not the best option. That made sense back in the days when our SQL Servers only had a couple of cores, but today, we’ve got huge, complicated processors.

Microsoft KB 2806535 gives MAXDOP recommendations, and the final is that you should set it to the number of cores in one processor, up to 8.
SQL Server 2005 and later versions
| Server with single NUMA node | Less than 8 logical processors | Keep MAXDOP at or below # of logical processors |
| Server with single NUMA node | Greater than 8 logical processors | Keep MAXDOP at 8 |
| Server with multiple NUMA nodes | Less than 8 logical processors per NUMA node | Keep MAXDOP at or below # of logical processors per NUMA node |
| Server with multiple NUMA nodes | Greater than 8 logical processors per NUMA node | Keep MAXDOP at 8 |
You can find information about NUMA concept here:
If you are using the GUI, you can enter a new value directly in the screen shown above. For T-SQL, use the following:
EXEC dbo.sp_configure ‘max degree of parallelism’, 8;
GO
RECONFIGURE;
GO
How do you know if you should change the value of max degree of parallelism?
If a query is run with multiple threads, and one thread completes before the others, then SQL Server will report the wait type CXPACKET for that thread. In SQL 2005 and later, you can also see it with the sys.dm_os_wait_stats dynamic management view. But I found a very useful query to identify top wait states on your server:
WITH Waits
AS (SELECT wait_type
,wait_time_ms / 1000. AS wait_time_s
,100. * wait_time_ms / SUM(wait_time_ms) OVER () AS pct
,ROW_NUMBER() OVER (ORDER BY wait_time_ms DESC) AS rn
FROM sys.dm_os_wait_stats
WHERE wait_type NOT IN (
‘CLR_SEMAPHORE’,
‘LAZYWRITER_SLEEP’,
‘RESOURCE_QUEUE’,
‘SLEEP_TASK’,
‘SLEEP_SYSTEMTASK’,
‘SQLTRACE_BUFFER_FLUSH’,
‘WAITFOR’,
‘LOGMGR_QUEUE’,
‘CHECKPOINT_QUEUE’,
‘REQUEST_FOR_DEADLOCK_SEARCH’,
‘XE_TIMER_EVENT’,
‘BROKER_TO_FLUSH’,
‘BROKER_TASK_STOP’,
‘CLR_MANUAL_EVENT’,
‘CLR_AUTO_EVENT’,
‘DISPATCHER_QUEUE_SEMAPHORE’,
‘FT_IFTS_SCHEDULER_IDLE_WAIT’,
‘XE_DISPATCHER_WAIT’,
‘XE_DISPATCHER_JOIN’,
‘SQLTRACE_INCREMENTAL_FLUSH_SLEEP’,
‘ONDEMAND_TASK_QUEUE’,
‘BROKER_EVENTHANDLER’,
‘SLEEP_BPOOL_FLUSH’)
)
SELECT W1.wait_type
,CAST(W1.wait_time_s AS DECIMAL(12, 2)) AS wait_time_s
,CAST(W1.pct AS DECIMAL(12, 2)) AS pct
,CAST(SUM(W2.pct) AS DECIMAL(12, 2)) AS running_pct
FROM Waits AS W1
INNER JOIN Waits AS W2 ON W2.rn <= W1.rn
GROUP BY W1.rn
,W1.wait_type
,W1.wait_time_s
,W1.pct
HAVING SUM(W2.pct) – W1.pct < 99
OPTION (RECOMPILE); — percentage threshold
As a result you can see: wait type, wait time in ms, percentage, and running total percentage. If CXPACKET on your server is more than 5% of your wait time than you need to tune values for Cost threshold of parallelism and MAXDOP.
From time to time you need to reset your wait stats. For that just use the following command:
DBCC SQLPERF(‘sys.dm_os_wait_stats’, CLEAR)
I hope that this article will help you better understand how to set up Cost Threshold for Parallelism and Max Degree of Parallelism you’ll be able to take advantage of their awesomeness very soon.
